
Most articles about the algorithms of the multi-armed bandit are too academic. They are filled with formulas and seem to imply that we have an immutable set of handles for pulling and n→∞ attempts. I will try to talk about these algorithms from the point of view of an ordinary developer, taking into account the real conditions in which our iFunny application for recommending memes works.
The choice of a suitable algorithm is associated with a long and painstaking work of analysts, a huge number of hypotheses, A/B tests, business metrics and graphic indicators, as well as the search for compromises. The developer must implement everything so that everything works efficiently and quickly. In addition, it is desirable to make sure that you do not need to set up a separate data center. Hopefully, this article will help developers deal with the last two problems.
The Challenge
We use bandits to select the best push notifications and solve other problems in the field of content recommendation. Since this is an article about a specific use case, I will also use terms from our area of expertise:
- view (n) = attempt;
- smiley (s) = victory;
- smiley rate (w = worth) = number of smileys/number of views;
- content = something that has views and smileys.
Roughly, the task of the multi-armed bandit is as follows: not knowing in advance how good the content that users upload to our application is, we need to maximize the final smiley rate. However, this task is good only from the point of view of the average consumer of content. In real life, everything is somewhat more complicated.
There are many ins and outs. For example, there are content creators who care about attention (i.e., views). Personalization tools need to collect enough data on all content, not just the top one (you can’t miss good content because it’s a bit unlucky). And so on.
There’s a little more context. In our iFunny app, tens of thousands of pieces of contentitalic text are in simultaneous rotation. At the same time, new content constantly arrives at an average speed of one meme in a couple of seconds, and old content is excluded from rotation at the same rate. That is, our set of content is not static, otherwise, any algorithm could, in one way or another, converge and begin to solve the problem as efficiently as possible. It’s a pretty fluid structure, constantly getting new content that we don’t know anything about. In addition, verified memes with smileys are also constantly removed.
We experimented with four algorithms
Namely:
- UCB1.
- eGreedy.
- Thompson Sampling.
- Wilson.
I will talk about the experience of using each of them. For clarity, I added animation and the final state of the full-scale experiment for each algorithm. The test itself was conducted according to the following methodology:
- 1,000 pieces of content with a predefined smiley rate and normal distribution from 0.0 to 0.006.
- 10,000 users. Everyone has a browsing history, and they won’t get the same content again.
- 10 iterations, where each user in turn requests 10 pieces of content (a total of 1,000,000 views).
- The weight of the content is calculated honestly. We use not a reference, but a real smiley rate, depending on the number of views and smileys of a particular unit of content.
- Smileys are placed relatively honestly. When the real smiley rate drops below the reference rate, there is a 10% chance that the next user who saw this content will put a smiley.
UCB1
This is a deterministic algorithm and with the same input data, it will return the same response.
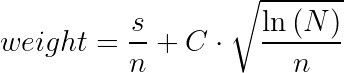
Where:
- s stands for the smileys;
- n stands for the views;
- С stands for the coefficient;
- N stands for the total number of views for all content.
As you can see, the left part determines the “profitability” of specific content, and the right part is responsible for exploration (it gives a chance to show itself well to content with a small number of views). By changing the C coefficient, you can influence the balance between earnings and exploration to some extent.
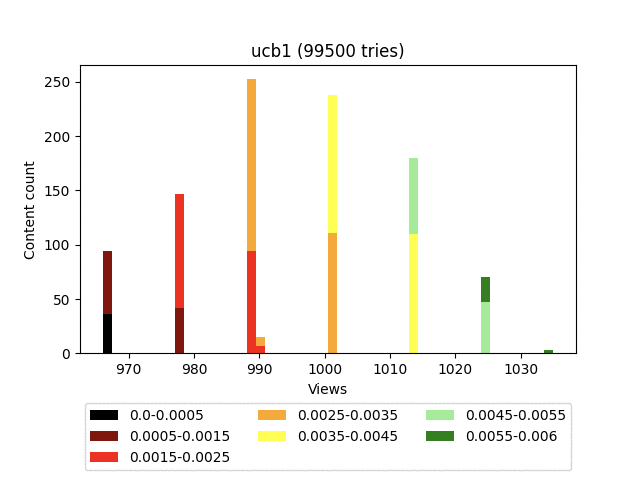
Result:
Animation:

Pros:
- It is easy to implement.
- It is not demanding on computing resources.
- Weight can be partially calculated on the fly when changing the statistics of specific content, which speeds up the display of content to the user.
Cons:
- The most difficult part of the calculations is performed at the time of processing the sort request, since it is related to the total number of views for all content. It would have to recalculate everything on the fly. However, with a sufficiently large total volume of views, you can not waste time calculating sqrt(ln(N)), but take its value as a constant. If there are deviations, they will be so minuscule that they will not cause any real damage to accuracy. You can also cache roots for all n values within reasonable limits. Memory consumption will increase slightly, and the speed will increase greatly.
- This algorithm has a very strong component responsible for exploration. In addition, as you can see in the diagram, it generally pulls up all the content in the form of a fairly dense group.
Thus, given the constant rotation, old quality content loses a lot to new content with a small number of views.
Let’s take N=10,000 and C=1 to see how two different groups of content behave.
Content group 1:
- views = 500;
- smileys = 50;
- weight = 0.1 + 0.14 = 0.24.
Content group 2:
- views = 1,000;
- smileys = 100;
- weight = 0.1 + 0.09 = 0.19.
It would seem that the preservation of such a smiley rate for 1,000 impressions is an indicator of quality, but there is practically no chance to please the user with this content.
Let’s calculate the minimum smiley rate that content with 500 views must possess in order to defeat an honored “veteran”:
- smiley rate + SQRT(ln(10,000)/500) > 0.19
- smiley rate > 0.05
You need to have only 25 smileys for 500 views. This is objectively twice as bad. But the content seems to be fresh. However, the essence of the multi-armed bandit task is precisely that it is necessary to maintain a reasonable balance between “earning” on good content and exploring new content. Let’s move on!
eGreedy
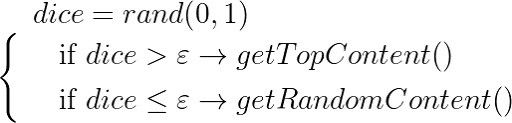
The essence of the algorithm is extremely simple: there is a certain threshold value (epsilon), we roll the dice and, if the result is greater than this value, then we display the top sorted by the smiley rate. If the value is less, we enable exploration and display random content.
Result:

Animation:
Pros:
- It is very easy to implement.
- It consumes very little computing resources.
- Weight is calculated on the fly when the statistics of specific content change.
- The algorithm finds the most valuable content pretty quickly and launches it into space.
Cons:
- It’s a maximalist algorithm, as it will end up looking to send all content to outsiders except for one “best” option.
- It doesn’t have mechanisms to cut off uniquely bad content.
The algorithm is very good at bringing really high-quality content to the top, but at the same time does not make any distinction between “good” and “bad” within a much larger group of memes. This results in a very uneven user feed, where the top-end content will be mixed with outright garbage in fairly large quantities, which doesn’t affect the depth of viewing very well.
**Since the weight of the content is calculated in an extremely primitive way, **it does not pessimize content with a large number of views and gives equal chances for both the verified 100/1,000 and the upstart newcomer 1/10. It turns out to be a situation opposite to UCB1, since the loss is always potentially good content with fewer views.
- Content_1=100/1,000=0.1
- Content_2=10/100=0.1
Now let’s give each one an additional view. It seems like a trifle, but the results will be as follows:
- Content_1=100/1,001=0.0999
- Content_2=10/101=0.0990
Oops. We fall out of the top, and all our hope is for random display. We use constant rotation of content, so for us this is a rather unpleasant feature.
Wilson
Like UCB1, it is a deterministic algorithm.

Where:
- w stands for the smiley rate;
- n stands for the view;
- z stands for the constant that defines the value of the confidence interval;
- ± determines at which boundary of the confidence interval we will calculate the weight.
The multi-armed bandit problem uses the upper limit of the confidence interval. The lower limit of the confidence interval, as a nice bonus, can be used to get the topmost top.
Result:

Animation:
Pros:
- The weight is fully calculated on the fly, as it is only associated with statistics for specific content. When displaying the results to the user, we do not need to run through the entire set and additionally calculate the weight. Instead, you can immediately calculate the greatestN sample and enjoy your life. Sorting is also not necessary, as there are much more cost-conscious solutions for choosing the N best.
- It gives a good distribution. It qualitatively pessimizes content that is definitely bad.
Cons:
- The formula is terrible. This disadvantage can be slightly smoothed out by multiplying the upper and lower parts of the equation by n.
I think you noticed a rather strange final distribution that looks like a fence. This is due to the fact that it is strictly deterministic and is associated exclusively with the statistics of the content itself. Roughly speaking, for a large number of iterations, content that has an equal number of smileys will also have an equal number of views.
In our particular circumstances, this is just a feature.
Thompson Sampling
It is the most mathematically complex algorithm. In simple terms, for each piece of content, we create a beta distribution and take its value at a random point.
I will not provide the formulas, since there are a lot of articles of varying degrees of scientificity about this algorithm on the Internet. But graphically it looks like this:
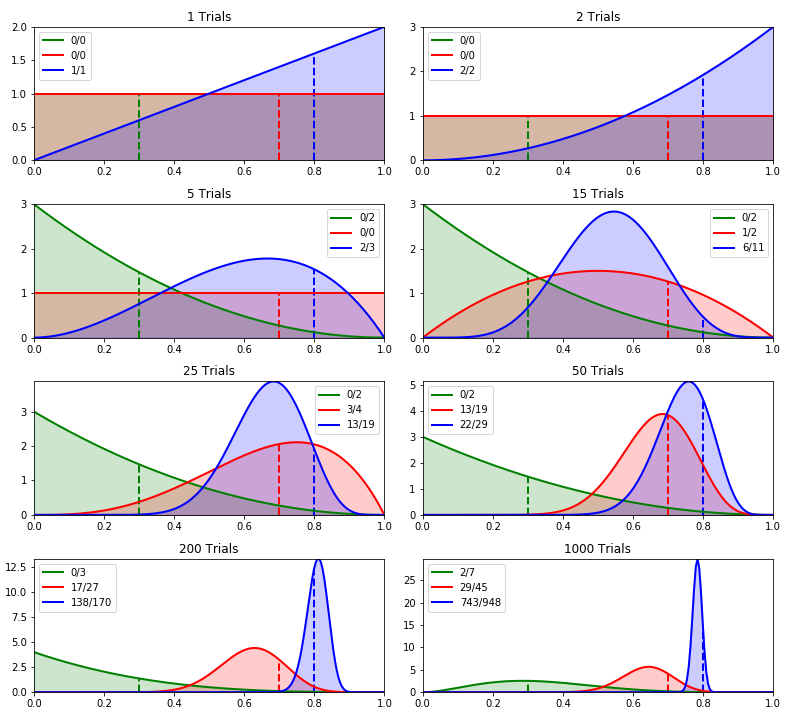
Source: https://towardsdatascience.com/thompson-sampling-fc28817eacb8
Result:


Pros:
- It gives a good distribution. It qualitatively pessimizes content that is definitely bad.
- It’s damn beautiful in graphical representation.
Cons:
- It is very heavy in terms of consumption of computing resources.
- It’s very difficult to implement. Also, it doesn’t have suitable libraries for Java.
- The algorithm is monolithic and does not offer any out-of-the-box settings that affect the exploration.
- Because of the randomizer, the weight must be calculated at the time of sorting.
Life hack: the complexity can be partially decreased by calculating in advance the beta distributions for all reasonable values of smiley/view pairs.
Another life hack: you can cache the sample values for all these pairs in increments, for example, 0.01. Then it starts to work quite quickly, but at the expense of reducing accuracy and increasing memory consumption. For example, we believe that a reasonable number of views lies in the range of 0 … 5,000, and a reasonable number of smileys lies in the range of 0 … 500.
As a result we get the following: 5,000 × 500 × 100 (samples) × 4 (bytes in float) = ~1GB of memory.
Ultimately, it’s not so scary, but it’s up to you.